
EnergySavvy: Quantifying energy efficiency at utility scale
Machine learning to solve the counterfactual: how much energy was "saved" as a result of implementing residential energy efficiency measures?


EnergySavvy was a SAAS company focused on residential energy efficiency projects. After we left, EnergySavvy was acquired and merged into what is now Uplight. The products we worked on evolved into some of Uplight's foundational services, including Next Best Action and Digital Customer Engagement.
Jason built the team and product for Quantify, EnergySavvy's first "big data" endeavor. The project involved modeling home energy savings at utility scale to close the feedback loop on energy-saving measures.
The context
“Energy efficiency is one of the easiest and most cost-effective ways to combat climate change, reduce energy costs for consumers, and improve the competitiveness of U.S. businesses. Energy efficiency is also a vital component in achieving net-zero emissions of carbon dioxide through decarbonization.”
- U.S. Department of Energy
Aaron Goldfeder, the CEO of EnergySavvy, puts it even more concisely:
“The cleanest energy is the energy we don’t use.”
Like our previous case study on Energy Raven, EnergySavvy focused on a tiny sliver of the climate problem: energy inefficiency (overuse) in residential buildings. However, EnergySavvy worked directly with utility companies to help them manage their energy efficiency retrofit programs.
If you consider this for a moment, you may wonder: why would utilities, which sell energy, try to help their customers to buy less energy?
In the U.S., public utility companies are a strange beast: semi-privatized, semi-public, heavily regulated, government-sanctioned monopolies. Their economic incentives are often backwards from what you might reasonably expect in a normal supply-vs-demand-driven capitalist market. Utility companies ostensibly sell a product (electricity) to customers (residential and commercial building owners). As such, you’d expect them to be incentivized to maximize sales, i.e. get electricity consumers to consume more electricity. However, due to a combination of enormous capital outlay to increase capacity, and closely-monitored regulations capping the price they can charge for their product, utility companies are often instead incentivized to employ Demand Side Management (DSM) strategies, to reduce energy demand or at least shift it from peak hours. DSM practices include subsidizing homeowners in performing energy efficiency retrofits on their home—think improving insulation by adding weather stripping, replacing an old inefficient refrigerator with an Energy Star-certified one, or upgrading the HVAC system to use a heat pump.
The problem
There’s an interesting question here. If a utility helps thousands of its customers perform these energy efficiency upgrades, how do they know how much energy was saved as a result?
In data science, this is a classic “counterfactual” problem. How do you know how things would have been different if you hadn’t made a given change? How do you know how much energy you didn’t use?

In the utility world, this question is more than just philosophical. Utilities are required to participate in Measurement & Verification (M&V), a “process of planning, measuring, collecting and analyzing data to verify and report energy savings within a facility or facilities, resulting from the implementation of energy-efficiency measures”—Bonneville Power Administration
The solution
EnergySavvy built a software product that applied cutting-edge machine learning (ML) to automate this M&V process—this automation is known in the industry as “M&V 2.0.” The product slurped up utility-scale energy usage data and fed it into an ML pipeline to “calculate” how much energy was saved by a given energy efficiency treatment.
Savings Measurement 101
The basic approach to savings measurement is:
Collect energy usage data for a pre-treatment period (say, for the year before you install your new heat pump).
Create a model of each home before treatment. This is your baseline model. The model1 is trained with your pre-treatment data to predict the amount of energy used by the baseline home under a variety of conditions. The most important input to this model is weather data, since HVAC systems account for most of a home’s variable load.
Collect energy usage data for a time period after treatment.
Run your baseline model, which represents your unmodified home, with your post-treatment weather conditions to estimate how much usage the home would have used in the post-treatment period, if it hadn’t had the treatment (in this case, the new heat pump).2
Finally, measure your savings by taking your actual post-treatment usage from step (3), and subtracting your modeled usage from step (4).
energySavings = actualEnergyUsagePostTreatment - modeledEnergyUsageBoom. Easy, right?
It’s not that easy
While the 101 method above can get you a crude estimate in ideal conditions, it’s not robust enough to “take to the bank” - or to regulators. To be useful, you need to account for factors such as:
Drift
Drift is an issue in Machine Learning in general; it occurs anytime that you build a model with data from a given time period and then use it in a later time period. Factors that underly the model are expected to remain constant, but in reality they can and will drift. One common culprit in residential energy efficiency is macroeconomic factors—for instance, in the 2008 recession, energy got more expensive and everybody tightened their belts and used less energy. If you naively used the formula above, it would look like everybody had a highly effective energy intervention.
Luckily, statistical tools for this abound. Models for this date at least back to the 1980s with the Princeton Scorekeeping Model (PRISM), which prescribes using a control group of homes to compensate for population-wide drift factors:

The general gist of this is the same as any controlled trial: you create a “control group” out of a population that didn’t receive a treatment (in this case, similar homes that did not get a heat pump installed) and compare the outcomes from the treated group with the outcomes of the control group.
Model uncertainty
You may have heard the adage: All models are wrong; some are useful.
No energy usage model can account for every factor affecting energy usage, so any savings estimate has limitations. It can be tempting to ship a model without studying this uncertainty. At the end of the day though, the difference between a useful model and a useless one is how well you understand its limitations. At EnergySavvy, we developed a machine-learning-based approach that allowed us to build a customized uncertainty model for each home, simultaneously compensating for drift.
All models are wrong; some are useful.
The difference between a useful model and a useless one is how well you understand its limitations.
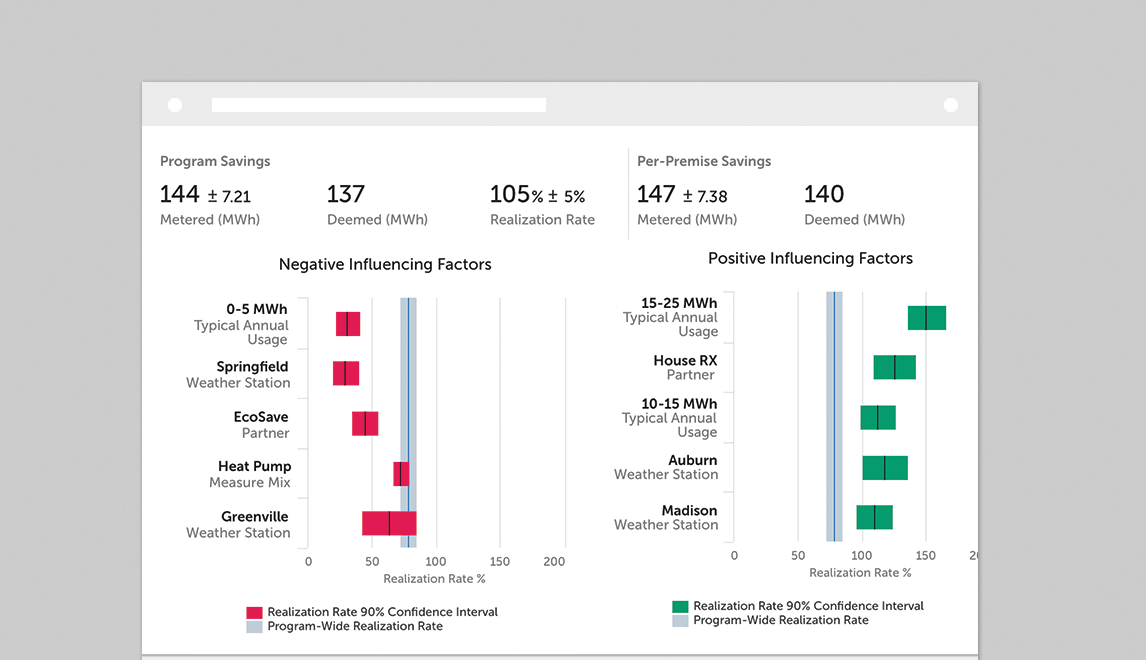
With a robust understanding of model uncertainty, we were able to assess which types of retrofits were performing better or worse, and which might be average or on a “watch” list.
…and there’s more
Beyond these, a utility must consider other factors, including free ridership and the rebound effect, to take credit for any improvements it subsidizes.
The software
From a software perspective, once you have all of the above figured out, it’s just a S.M.O.P.—Simple Matter of Programming. Plug the data into the algorithms and turn the crank!
Just make sure you get these things right:
Observability & provenance: When something weird shows up in the results, you’ll want to be able to explain it. For the Quantify product, we instrumented our data pipeline with a wide range of diagnostics from end to end, so that we could understand the effects of any code change that we made.
Big-ish data: utilities often have customer counts in the millions. When processing multiple years of data for each home, the GBs start to add up. While you don’t necessarily need to use heavyweight map-reduce or streaming machinery to get the job done, choosing your data stores appropriately and avoiding reprocessing can pay dividends here.
Compute costs and timing: Operational cost is a minor issue in many software applications. What’s $30 per month in operational costs when you’re paying an engineering team? With the big-ish data and complex algorithms, comes the potential for substantial ($1000 per month and up) compute costs. In addition, processing large amounts of data can take real wall-clock time, constraining your ability to iterate and deliver quickly.
Error handling (or Murphy’s Law as applied to Data): Everything that can go wrong with the data, will go wrong with the data. In practice, this means you want off-ramps in your data pipelines, where problematic or outlier data can be flagged for analysis without bringing the system to a screeching halt.
In conclusion…
The cleanest energy is the energy we don’t use. At EnergySavvy, we put the “efficiency” into energy efficiency by helping utilities roll out optimized programs supporting residential energy efficiency at scale.
There is a whole world of model types to quantify & predict energy usage in buildings. Leave a comment if you want to hear more on these models in a later post!
Another option here is to re-fit a model to the post-treatment data, and pull your savings values from the fitted parameters of the model.